
Do you ever stalk the Instagram of that artsy coffee shop down the street, or find that you can’t look away from a creative Facebook video about your favorite online store?
If yes, you’re either procrastinating to avoid doing something that actually matters (we’ve all been there), or you’ve come across a business that’s nailed their brand strategy to a T.
There are some brands that just know how to draw us into their posts, whether on Facebook, Instagram, Pinterest, or Twitter. These brands have mastered the art of social media marketing, or the creating and posting of social media content to attract and engage customers.
In this day and age, most companies know that posting on social media is one of the best ways to market their brand – but not every company knows how to evaluate whether their posts are actually effective.
That’s where brand analytics comes in. By using various tools and tactics to track your brand’s social media campaigns and monitor user engagement, you can get a good sense of how your brand is performing with your audience.

Brand analytics refers to gathering data about your social media posts and using that data to improve your branding and marketing strategy. This data includes brand engagement metrics such as your number of followers, shares, and likes.
Online analytics tools use algorithms to condense all this data into quantified scores. These metrics indicate the success of your posts as well as customer perceptions of your brand.
It’s simple: Analytics help you boost your brand and make informed marketing decisions.
By analyzing the performance of your posts on social media, you can see which posts users enjoyed, and which ones they ignored. That way, you can improve future content based on the kinds of posts users did and didn’t engage with.
Let’s say your company is just beginning your branding strategy on Facebook, and you have no idea which captions will generate the highest customer engagement.
You can test a couple of different captions across several posts, and using analytics, you can check which caption works best. That is, you can create two different but similar posts—perhaps with the same image but a different caption—and use an analytics tool to determine which post gets more engagement.
That’s the purpose of analytics: When you’re well-informed about the success rates of your posts, you can constantly improve your social media strategy until you get the best possible consumer response.

While the basic principles of brand analytics remain the same, different social media platforms require different analytics tools:
Note that while there are plenty of great third-party analytics tools out there, this post will focus on the native tools embedded in the social media platforms themselves – so for those who are branding on a budget, you won’t need to worry about any extra costs.
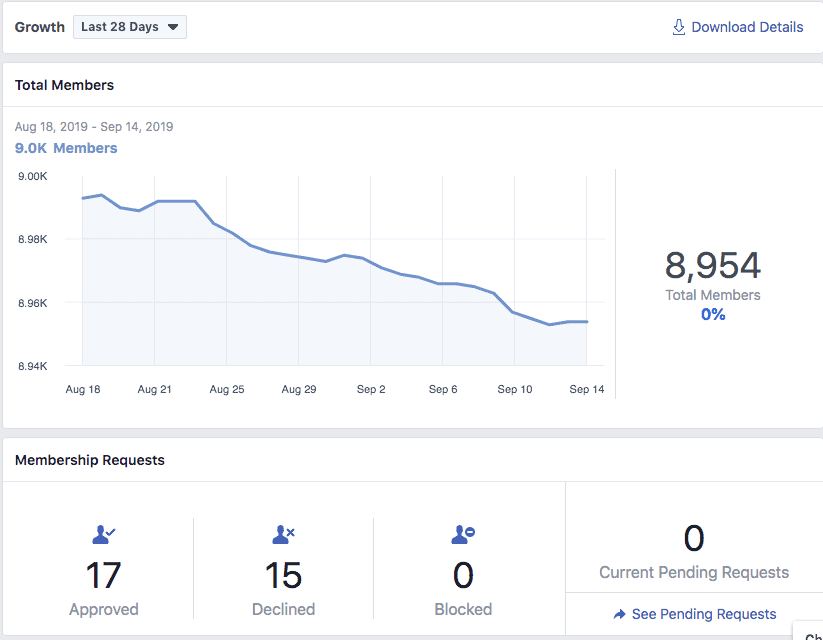
You can monitor brand analytics on Facebook using the Facebook Insights tool. To navigate to the Insights tool, start at your company’s Facebook page. Click the gear icon and select “View Insights.” That will open up the main Insights dashboard.
The dashboard will reveal a graph of analytics, data such as your brand’s total number of likes, the potential number of people you can reach (measured by the number of friends of fans), the number of people actively talking about your page, and your weekly reach.
Here’s how to review your Facebook analytics data and drive brand engagement:
Learn how to create top-performing Facebook posts by checking your virality.
Below the graph on the main dashboard, you’ll see the analytics data for specific posts: the date of the post, its title and reach, how many users engaged with the post, how many users spread the word about the post, and the virality of the post.
Your top-performing posts are those with the highest levels of virality. Analyze the characteristics of these posts so that you can figure out what went well. That way, you can create similar types of content in the future.
Understand your Facebook audience by looking at your fans’ demographics.
Within the Insights tool, clicking “Likes” will reveal information about the demographics, locations, and ages of your fans. You can also check the “Talking About This” section to find out the demographics of people talking about your page. Are your fans mostly male or female? Do they tend to be younger or older? Are they based in the US or somewhere else?
Take a close look at your audience. Understanding who comprises your audience—what they’re interests are, what they need, and how they talk—is the first step to creating the right kind of brand content.
Improve future Facebook posts by analyzing your reach.
The Facebook Insights tool also helps you check how much of your brand’s content is actually reaching your fans. The “Reach” section reveals page views and unique visitor views. It also shows which types of posts—paid, organic searches, or viral—reached more audiences.
By reviewing your brand’s reach, you can determine which of these post types is most effective so that you can create more of these posts in the future.
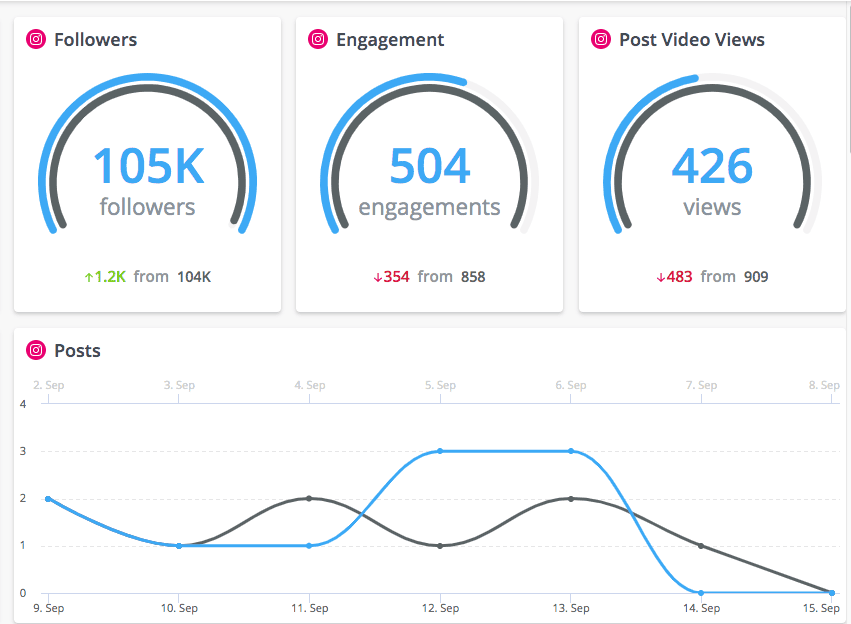
As we mentioned above, you can use Instagram Insights to monitor analytics on Instagram. Access the data by tapping the bar graph icon in the upper right-hand corner of your Instagram screen. You can also view analytics for an individual post by tapping “View Insights” in the bottom-left corner of that post. To look at data for a particular story, open the story and tap the names on the bottom left.
On the Insights homepage, you’ll find the analytics data for the content you’ve posted within the last seven days. You can view information such as the number of followers you’ve gained and lost within the past week, how many posts you’ve added in the past week, and how many posts you have in total.
Understand your Instagram audience by looking at your followers’ demographics.
Scroll down to the “Followers” section to view your followers’ demographics. The available demographic information includes the age range, gender, and location of your followers.
Remember, understanding your audience is essential for understanding how to effectively target them with your online content. For paid Instagram campaigns, target the demographics of your current audience in order to reach similar types of followers.
Maximize your reach on Instagram by learning your followers’ online behavior.
In addition to showing your followers’ demographics, the Insights page also reveals your followers’ online behavior. The analytics tool displays the times and days of the week your followers are online so that you can be sure your posts are reaching them.
Create an Instagram posting schedule that reflects when your audience is most active online. That way, you can post content on the precise days and times your audience is most engaged.
Create engaging Instagram posts by evaluating your top-performing content.
The Insights page gives you a view into certain metrics over a particular time period, including comments and likes, impressions, ratio of engagement to reach, and best and worst-performing types of content.
Be sure to also view the metrics of individual posts, both organic and promotional, to learn whether users followed you, viewed your profile, or clicked on your website after seeing your post. In the case of Instagram Stories, you’ll want to check which content your audience watched all the way through, and which content caused users to swipe away.
By identifying which posts are more successful than others, you can get a better idea of which types of content your audience prefers—and use more of that type of content in your Instagram strategy.
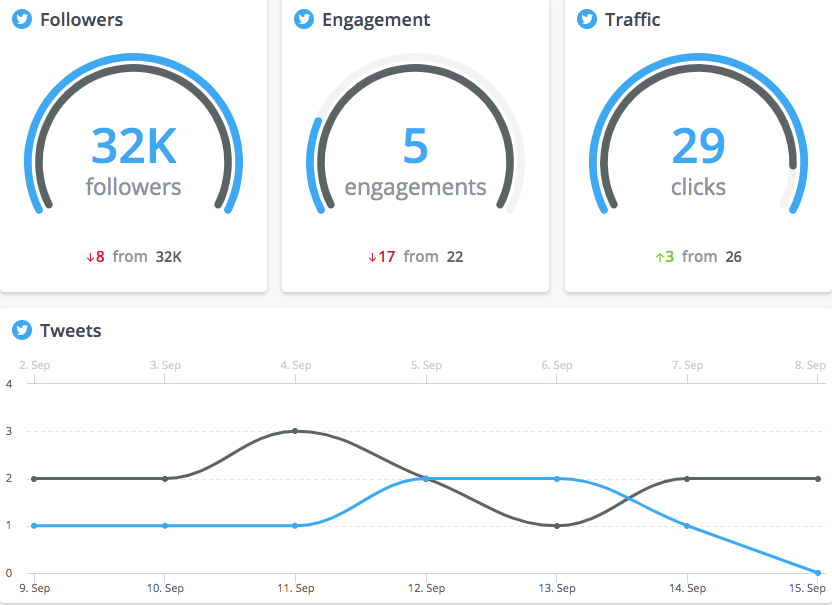
You can monitor analytics on Twitter using the native Twitter Analytics tool. Go to the Twitter Analytics page to access the main dashboard.
Get to know your Twitter audience by looking at your fans’ demographics.
Click the “Audiences” tab at the top of the page to see data about your audience. You’ll be able to find information about your audience’s age, gender, and location, as well as their main interests, top language, lifestyle and buying style, and their devices and wireless carriers.
Once you understand your audience, you can use that information to create and share content that appeals to them and to retweet content from influencers your audience admires. You can also maximize your reach by scheduling tweets based on your audience’s location and time zone.
Drive engagement on Twitter by strategizing around upcoming events.
At the top of your Twitter Analytics dashboard, you’ll see an “Events” tab. Clicking on the tab reveals a long list of upcoming events, which you can filter based on date, event type, and location. Apply filters based on your audience’s location and interests. Then, take advantage of the hype surrounding an event by posting about it. This will engage audiences and attract additional followers.
Improve future Twitter posts by learning from your top-performing tweets.
Click the “Tweets” tab at the top of your dashboard, and then click the “Top Tweets” tab, to learn which kinds of Tweets perform best. Look for common features shared by your top performing tweets. Do they speak in a specific tone, use similar images, or use a particular hashtag or call-to-action? Create new tweets that have the same qualities as your top-performing ones. Not only will that help you target the right audiences, but it will also help you hone in on the language and tone that best represent your brand.
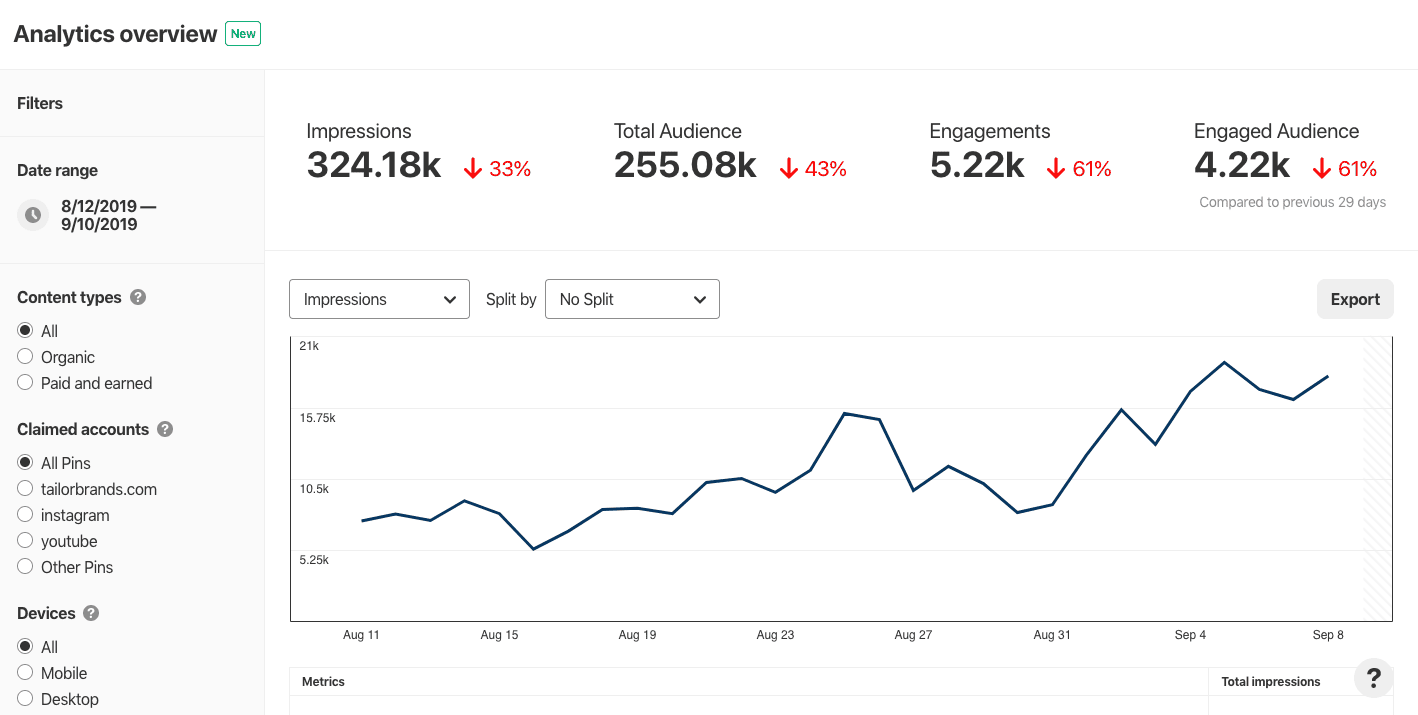
Evaluating your brand’s performance on Pinterest can help you discover which posts are and aren’t resonating with your audience.
To access your analytics data, go to the Settings drop-down menu at the top right-hand corner of the page.
Know your Pinterest audience by analyzing demographics and affinities.
The Pinterest Analytics tool offers audience insights like gender, language, and country. This allows you to fine-tune your content strategy so that you can post for the right audience, in the right language, and at the best time of day.
But even more valuable is the “Affinities” section of the Pinterest Analytics tool. This section reveals your audience’s interests—the main categories they engage with, the other business accounts they follow, and the top boards your content is pinned to.
As with other social media platforms, knowing your audience is critical to creating engaging posts. The better you know your audience, the more your posts will resonate with them—and the more popular your brand will be.
Update your Pinterest strategy by evaluating your reach.
Reach lets you know how many people saw your posts, whether through your own pins or through other people’s re-pins of your content. To find out your reach, scroll down to the “Impressions and Reach” section of the Pinterest Analytics dashboard.
While it’s great if you have a wide reach, you shouldn’t count that as a success just yet. The reason your reach is important is because it allows you to calculate the ratio of how many people actually engaged with your content versus how many people saw it. If your brand content had a lot of impressions (views) but not many pins or re-pins, then it’s probably time to revise your posts to make them more engaging.
Improve future Pinterest content by identifying top-performing posts.
Pinterest’s analytics tool shows you which content is most pinned, re-pinned, and clicked. This data indicates which posts resonate best with your audience.
Based on your most successful posts, you can determine what kinds of content your audience connects with. For example, they might respond well to inspirational quotes, bright colors, or informative how-to’s.
Your number of re-pins also gives your brand exposure to people who aren’t following you, presenting additional opportunities for pins, re-pins, and clicks.

Now that you know how to monitor the success rates of your social media posts, you can use that information to improve the performance of your brand.
To maximize your exposure and engagement on social media, keep the following tips in mind:
Each platform offers different ways to speak to and engage with users. Many prospective customers are active on just one or two channels, or respond to some types of content better than others. When you post a variety of content types across several channels, you maximize your brand’s exposure and reach.
If your brand is still relatively unknown, one way to gain attention on social media is to share posts from popular influencers relevant to your audience. You can share anything from influential articles to important quotes to celebrity content, as long as they’re relevant to your brand and consistent with your brand image.
Social media provides an opportunity for your brand to interact in real time with your audience. Interaction is a great way to humanize your brand and gain customer trust. Users will appreciate that your company cares enough to address their questions, comments, and concerns.
While it’s important to post across different channels, you should also maintain a strong and cohesive brand identity. Speak in the same language, use the same tone, and reflect the same values and messages across all social media channels. You’ll want a clear personality that users can recognize and come to associate with your brand.
Use the data gathered by native analytics tools to determine the demographics, lifestyle, and interests of your audience. Once you learn which kinds of people your content attracts, you can tailor future content to those same customer types.
Surprise and engage users with creative, original content. Depending on your brand and target audience, you might want to go for something artsy or humorous.
You can also create posts centered around events and holidays your audience loves, and use brand imagery to put your own spin on the event. Aim for original posts that offer thoughtful insight or provide genuinely helpful advice.
Once you apply these 6 tips, check your analytics data again. Evaluate your number of followers, engagement rates, and reach to see whether your brand’s performance has improved.
Compare the top-performing posts on each channel to determine which types of content attract your audience. This way, you’ll be able to hone in on what your audience loves most, and to learn from your successes and failures. By repeating this process through constant monitoring and evaluation of your data, you make your future content even better.
Analyzing brand analytics is part of monitoring each and every social media channel you manage, and it should help inform the strategies you use to move forward with your branding. It’s just as important to evaluate what’s not working well as the posts that perform the best, so you’re always keeping an eye out for ways to improve engagement.
The information provided on this page is for information, educational, and/or editorial purposes only. It is not intended to indicate any affiliation between Tailor Brands and any other brand or logo identified on this page.
Products
Resources
@2024 Copyright Tailor Brands